Our quantitative data comes from multiple days of monitoring traffic along Kendal Dr. When deciding how to best monitor traffic, we researched different tools that could be used and weighed their costs and benefits. Many of the professional tools were either expensive, hard to obtain, or had a steep learning curve. We narrowed down to two options: manually monitoring traffic or filming Kendal Dr and analyzing the footage. We picked the camera option as they are discrete and can capture hours of data per day, whereas our schedules would have greatly limited how often and long we could monitor traffic. The cameras discreetness was also a key factor in the decision, as we didn’t want our presents on the road to impact our data.
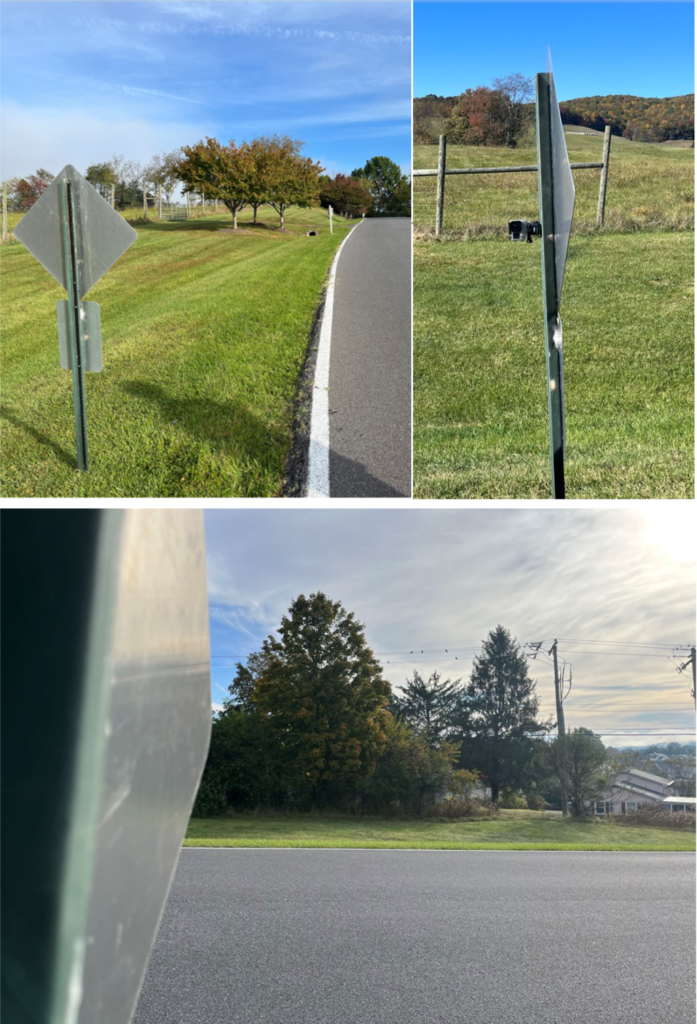
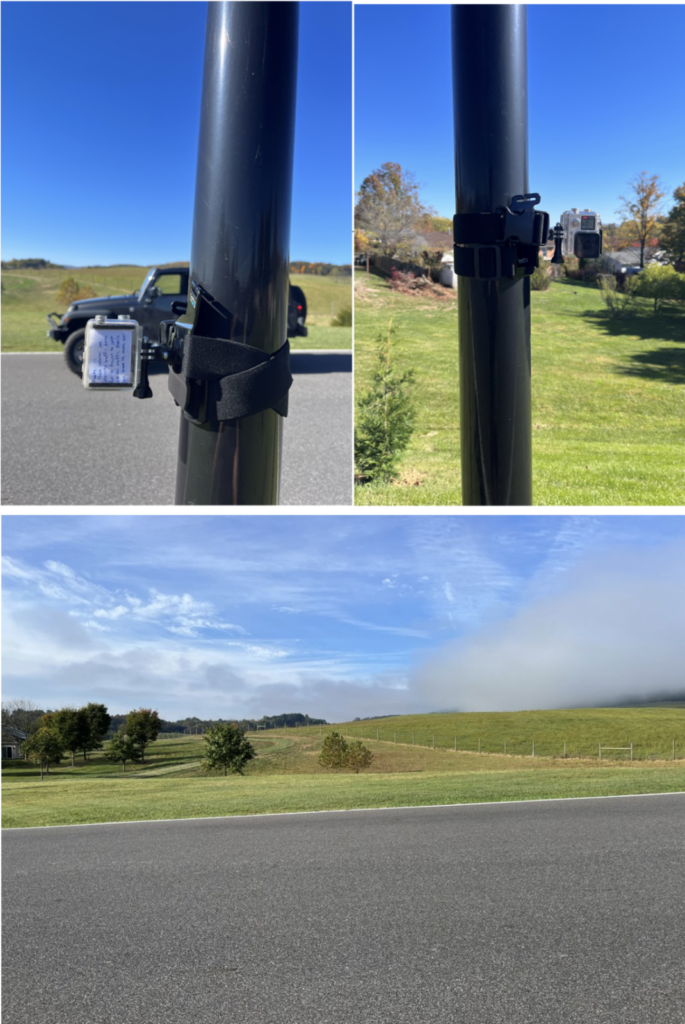
We used two GoPro Hero 4s to film Kendal Dr. We chose these cameras because they are easily mounted, weatherproof, can film up to 3 hours, and are already W&L property—so free to borrow. Before each filming session, we mounted the cameras 270 feet apart in the middle section of Kendal Dr, and synchronized the start of each recording. Below are the setups of the two cameras.
After the cameras died or ran out of storage, we retrieved them and analyzed the footage. Using the video editing software Adobe Premier, we aligned the videos and noted the time stamp of cars passing each camera. With simple subtraction and a measurement of the distance between the cameras, we calculate the average speed of vehicles in the central third of Kendal Dr. In addition to speed, we also noted vehicle type, time of day, and direction. We recorded data over a period of 6 days, between 2-3 hours of footage each day, between the times of 10:00 am and 4:00 pm. The following 3 figures represent the data we collected.
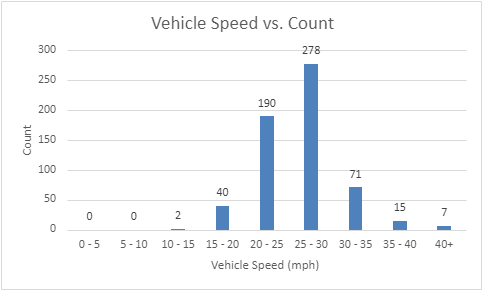
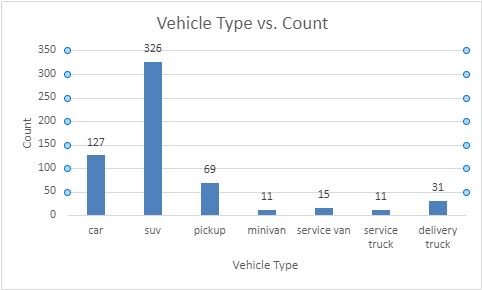
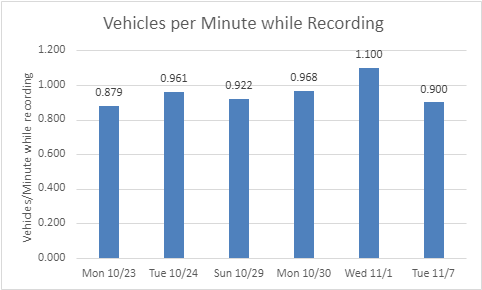
From figure 6, we can see that most vehicles are going between 20 and 30 miles per hour, and figure 7 shows that most vehicles are regular personal commuter or SUVs. This data is key when selecting traffic calming measures because we now know which types of vehicles we should design for and how much we should aim to lower the speed. The outliers of Figure 7 are the delivery and service vehicles. While they are not as prominent, they are still an important factor to consider as their vehicles may require special accommodation, so it will be crucial to get input from those drivers to inform an appropriate design. Figure 8 is important because it shows that there is not much variation in terms of vehicle volume from day to day.
The other focus for the design thus far was researching traffic calming measures. Our aim is that by analyzing different traffic calming measures and their effectiveness, we will be able to select the ones that work best for the circumstances of Kendal.